ViralBioinfLAC2022
Commonly used file formats for next-generation sequencing (NGS) data
In this session, we are going to get familiar with several common file formats used for sequence data. Then we are going to perform some quality control (QC) on some FASTQ-formatted sequence data.
FASTA
Among the most common and simplest file formats for representing nucleotide sequences is FASTA. Essentially, each sequence is represented by a ‘header’ line that begins with a ‘>’, followed by lines containing the actual nucleotide sequence. By convention, the first ‘word’ in the header line is a unique identifier, which is usually the accession number. Consider this example of a FASTA-formatted nucleotide sequence:
>LC719646.1 Influenza A virus (A/swine/Tottori/B34/2020(H1N1)) segment 8 NS1, NEP genes for nonstructural protein 1, nuclear export protein, complete cds
ATGGAATCCAACACCATGTCAAGCTTTCAGGTAGACTGTTTTCTTTGGCATATTCGCAAGCGATTTGCAG
ACAATGGATTGGGTGATGCCCCATTCCTTGATCGGCTACGCCGAGATCAAAAGTCCTTAAAAGGAAGAGG
CAACACCCTTGGCCTCGACATCAAAACAGCCACTCTTGTTGGGAAACAAATTGTGGAATGGATTTTGAAA
GAGGAATCCAGCGAGACACTTAGAATGGCAATTGCATCTGTACCTACTTCGCGTTACATTTCTGACATGG
CCCTCGAGGAAATGTCACGAGACTGGTTCATGCTTATGCCTAGGCAAAAGATAATAGGCCCTCTTTGCGT
GCGATTGGACCAGGCGGTCATGGATAAGAACGTAGTACTGGAAGCAAACTTCAGTGTAATCTTCAACCGA
TTAGAGACCTTGATACTACTAAGGGCTTTCACTGAGGAGGGAACAATAGTTGGAGAAATTTCACCATTAC
CTTCTCTTCCAGGACATACTTATGAGGATGTCAAAAATGCAGTTGGGGTYCTCATCGGAGGACTTGAGTG
GAATGGTAACACGGTTCGAGTCTCTGAAAATATACAGAGATTCGCTTGGAGAAGCTGTGATGAGAATGGG
AGACCTTCACTACCTCCAGAGCAGAAATGAGAAGTGGCGGGAACAATTGGGACAGAAATTTGAGGAAATA
AGGTGGTTAATTGAAGAAATACGACACAGATTGAAAGCGACAGAGAATAGTTTCGAACAAATAACATTTA
TGCAAGCCTTACAACTACTGCTTGAAGTAGAGCAAGAGATAAGAGCTTTCTCGTTTCAGCTTATTTAA
- The first line begins with ‘>’ indicating that it is the header line.
- This is immediately followed by ‘LC719646.1’, which is the accession number for this sequence in the GenBank database.
- Then follows the actual nucleotide sequence, split over several lines, beginning with ‘ATGGAATCCAACA…’ and ending with ‘…TTATTTAA’.
It is very common to combine multiple sequences into a single multi-FASTA file like this:
>ON084923.1 Influenza A virus (A/ostriches (Struthio camelus)/Egypt/Mansoura1/2022(H5N8)) segment 4 hemagglutinin, HA2 region, (HA) gene, partial cds
GTACCACCATAGCAATGAGCAGGGGAGTGGGTACGCTGCAGACAAAGAATCCACTCAAAAGGCAATAGAT
GGAGTTACCAATAAGGTCAACTCAATCATTGACAAAATGAACACTCAATTTGAGGCAGTTGGAAGGGAGT
TTAATAACTTAGAAAGGAGGATAGAGAATTTGA

>MW170960.1 Influenza A virus (A/swine/Italy/410927/2018(H1N2)) segment 6 neuraminidase (NA) gene, partial cds
CCTTATGCAGATTGCTATCCTGGTAACTACTGTTACATTTCACTTCAAGCAATATGAATACAATTTCTAC
CCAAACAACCAAGTAATGCCATGTGAACCAACGATAATTGAAAGAAACATAACAGAAATAGTGTACCTGG
CCAACACCAC

>MW170083.1 Influenza A virus (A/swine/Italy/134212/2019(H1N2)) segment 6 neuraminidase (NA) gene, partial cds
GTAGTAACTGCCTGAGTCCTAATAATGAAGAAGGGGGTCATGGGGTAAAAGGCTGGGCCTTTGATGATGG
AAATGATGTTTGGATGGGAAGAACGATCAGCGAAAAGTTACGATTAGGTTATGAAACCTTCAAGGTCATC
GACGGTTGGTCCAAGCC

>MW169741.1 Influenza A virus (A/swine/Italy/8745/2019(H3N2)) segment 2 polymerase PB1 (PB1) gene, partial cds
TCGTTCCATCCTCAATACTAGCCAAAGGGGAATTCTTGAGGATGAGCAAATGTATCAGAAGTGCTGCAAT
TTATTTGAGAAATTCTTCCCTAGCAGTTCATACAGGAGGCCAGTGGGAATTTCAAGCATGGTGGAGGCCA
TGGTATCTAGGGCCAGAATTGATGCACGGATTGATTTCGAGTCTGGAAGGATTAATAAAGAAGAATTTGC
TGAGATCATGAAGATCTGTTCCACCATAGAAGAGTTCAGACGGCAAAAGTAG

>OM149369.1 Influenza A virus (A/Hilly chicken/Bangladesh/Avian Influenza Virus/2019(H9)) segment 4 hemagglutinin (HA) gene, partial cds
AATTTCTTAGCTAGCAAAATGGAAACAATAACACTGATGACTACACTACTATTAACAACAACGAGCCTTG
CAGACAAAATCTGTATCGGCCACCAATCGACAAATTCTACAGAAACTGTAGACACACTAACAGAAACTAA
CGTTCCTGTGACACATGCCAAAGAGTTGCTCCATACGGATCACAATGGAATGCTGTGTGCAACAAATCTA
GGACATCCCCTCATCCTAGATAAATGTAACGTAGAAGGACTGATCTACGGCAACCCTTCTTGTGATCT
If you want a more detailed history of the FASTA file format, then you could take a look at the Wikipedia page here: https://en.wikipedia.org/wiki/FASTA_format.
FASTQ
The widely used FASTA file format has the great advantage of simplicity. However, this simplicity can be restrictive if we want to include additional data/metadata in addition to the sequence. Given the non-negligible error rates of NGS technologies, often we need to accompany our sequence data with quality scores that estimate our confidence in the accuracy of the sequence data. As we will see later, this allows us to perform quality control checks and filter-out poor-quality data before performing analyses. FASTQ is a simple text-based format that allows us to include quality scores. A single sequence is represented by four lines of text:
@ERR8261968.1 1 length=97
ACTTTCGATCTCTTGTAGATCTGTTCTCTAAACGAACTTTAAAATCTGTGTGGCTGTCACTCGGCTGCATGCTTAGTGCACTCACGCAGTATAATTA
+ERR8261968.1 1 length=97
CCCCCFDDFFFFGGGGGGGGGGHHHHHHHHHHHGGGGHHHHHHHHHHHHHHHGHHGHHIIHHGGGGGGHHHHHHHHHHHHHHHHHHHGGGHHHHHHH
- The first line is a ‘header’ containing a unique identifier for the sequence and, optionally, further description.
- The second line contains the actual nucleotide sequence.
- The third line is redundant and can be safely ignored. Sometimes it simply repeats the first line. Sometimes it is blank or just contains a ‘+’ character.
- The fourth line contains a string of characters that encode quality scores for each nucleotide in the sequence on ASCII code. Each single character encodes a score, typically a number between 0 and 40; this score is encoded by a single character.
| Character | ASCII | FASTQ quality score (ASCII – 33) |
|---|---|---|
| ! | 33 | 0 |
| “ | 34 | 1 |
| # | 35 | 2 |
| $ | 36 | 3 |
| % | 37 | 4 |
| … | … | … |
| C | 67 | 34 |
| D | 68 | 35 |
| E | 69 | 36 |
| F | 70 | 37 |
| G | 71 | 38 |
| H | 72 | 39 |
| 40 | 73 | 40 |
So, in the example above, we can see that most of the positions within the 97-nucleotide sequence have scores in the high 30s, which indicates a high degree of confidence in their accuracy.
- A score of 30 denotes a 1 in 1000 chance of an error, i.e. 99.9 %accuracy.
- A score of 40 denotes a 1 in 10,000 chance of an error, i.e. 99.99 %accuracy.
You can read more about the FastQ file format and quality scores here: Cock, P. J., Fields, C. J., Goto, N., Heuer, M. L., & Rice, P. M. (2010). The Sanger FASTQ file format for sequences with quality scores, and the Solexa/Illumina FASTQ variants. Nucleic Acids Research, 38, 1767–1771. https://doi.org/10.1093/nar/gkp1137.
SAM and BAM
A SAM file (usually named *.sam) is used to represent aligned sequences. It is particularly useful for storing the results of genomic or transcriptomic sequence reads aligned against a reference genome sequence. The BAM file format is a compressed form of SAM. This has the disadvantage that it is not readable by a human but has the advantage of being smaller than the corresponding SAM file and thus easier to share and copy between locations.
You can read about SAM and BAM formats here:
- Li, H., Handsaker, B., Wysoker, A., Fennell, T., Ruan, J., Homer, N., Marth, G., Abecasis, G., Durbin, R., & 1000 Genome Project Data Processing Subgroup (2009). The Sequence Alignment/Map format and SAMtools. Bioinformatics, 25, 2078–2079. https://doi.org/10.1093/bioinformatics/btp352 and
- https://samtools.github.io/hts-specs/SAMv1.pdf.
We can view BAM files graphically using specialised genome browsers software such as (we will be working with these in Module 7):
An example SAM file is shown in the image below, along with the 11 mandatory fields of this standard:
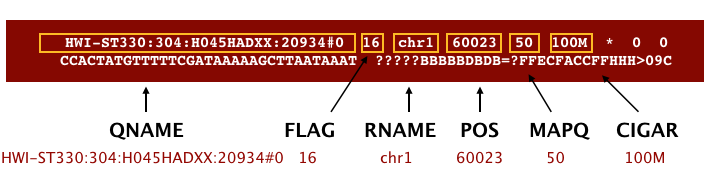
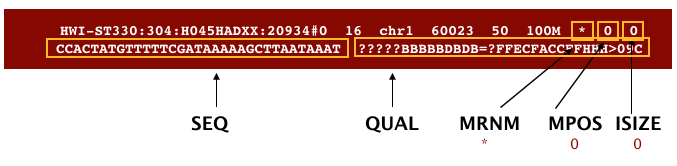
(Image from Data Wrangling and Processing for Genomics)
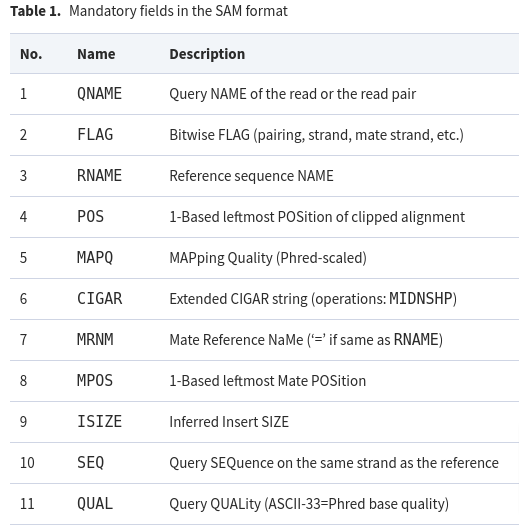
The meaning of each of these mandatory fields are detailed below:
Public repositories of NGS data
The Sequence Read Archive (SRA) contains a huge number of sequence reads generated by various NGS methods. We can browse this data on the web via the NCBI’s web portal. We can also download NGS datasets in FastQ format and analyse them locally, for example in our virtual machine. Let’s a take a look at an example dataset: SRR19504912
Question 1: Which virus does this sequencing dataset come from?
Let’s use the web interface to take a look at a few of the sequence reads in this dataset. Click on where it says SRR19504912 under ‘Run’. Then click on the ‘Reads’ tab. This will take you to this page, which looks like this:

In the figure above, we can see a single sequence read along with the quality scores for each nucleotide position in its sequence. Notice that the scores are high (well above 30) for most of this sequence read.
Now let’s download the sequence data (i.e. the whole set of reads) from this sequencing run from the SRA. Unfortunately it is not easy to download the data directly from the NCBI website; instead we have to use the fasterq-dump tool from the NCBI’s SRA Toolkit. We will be working in the directory /home/manager/course_data/NGS_file_formats_and_data_QC/. So, first execute this command in the Terminal:
cd /home/manager/course_data/NGS_file_formats_and_data_QC
The SRA Toolkit software is already installed on the virtual machine and we can execute it in the Terminal simply like this (it might take a couple of minutes):
fasterq-dump SRR19504912
You shouls see this information printed on your screen:
spots read      : 306,691
reads read      : 613,382
reads written   : 613,382
You should now have two new files in your NGS_file_formats_and_data_QC directory called SRR19504912_1.fastq and SRR19504912_2.fastq. There are two files because this dataset consists of paired sequence reads.
Question 2: What is the size of the files you have downloaded?
Take a look at the first few lines of each file by executing this command:
head *.fastq
Question 3: How many lines does a single sequence read take up in a FASTQ file?
Question 4: How many sequence reads are in each file?
Hint: Use
wccommand.
Quality control for FastQ-formatted data
Visualising quality metrics using FastQC
Let’s examine the quality of these sequence data using a really useful piece of software called FastQC.
We can launch the graphical interface by simply executing fastqc on the Terminal command line. However, it is often more convenient to use the software in the command-line mode. Execute the following command in the Terminal:
fastqc *.fastq
You will see some messages like this on your screen:
Started analysis of SRR19504912_1.fastq
Approx 5% complete for SRR19504912_1.fastq
Approx 10% complete for SRR19504912_1.fastq
...
Approx 90% complete for SRR19504912_1.fastq
Approx 95% complete for SRR19504912_1.fastq
Analysis complete for SRR19504912_1.fastq
Started analysis of SRR19504912_2.fastq
Approx 5% complete for SRR19504912_2.fastq
Approx 10% complete for SRR19504912_2.fastq
Approx 15% complete for SRR19504912_2.fastq
...
Approx 90% complete for SRR19504912_2.fastq
Approx 95% complete for SRR19504912_2.fastq
Analysis complete for SRR19504912_2.fastq
Now, execute the command ls -lh and you should see some new files have appeared:
total 400M
-rw-rw-r-- 1 manager manager 1.2K Jul 25 16:20 readME.md
-rw-rw-r-- 1 manager manager 199M Jul 31 13:26 SRR19504912_1.fastq
-rw-rw-r-- 1 manager manager 666K Jul 31 13:31 SRR19504912_1_fastqc.html
-rw-rw-r-- 1 manager manager 378K Jul 31 13:31 SRR19504912_1_fastqc.zip
-rw-rw-r-- 1 manager manager 199M Jul 31 13:26 SRR19504912_2.fastq
-rw-rw-r-- 1 manager manager 673K Jul 31 13:31 SRR19504912_2_fastqc.html
-rw-rw-r-- 1 manager manager 391K Jul 31 13:31 SRR19504912_2_fastqc.zip
We are most interested in the HTML files, which contain the FastQC reports for our two fastq files. Let’s open them with the following command:
firefox *.html &
You should then see something like this:

Note that there are two tabs in the Firefox web browser; there is one for the QC report for SRR19504912_1.fastq and another for SRR19504912_2.fastq.
There is a lot of QC information in these reports. Feel free to explore these in your own time and take a look at the FastQC homepage where you can find the explanation to each report FastQC is generating and we recommend you to watch the tutorial video at http://www.youtube.com/watch?v=bz93ReOv87Y.
For now, we are just going to look at
- Basic statistics
- Per-base sequence quality
- Adapter content
Question 4: Analysing FastQC report, how many reads are there? Does this answer match your previous answer (based on wc command)?
Question 5: With respect to quality scores, which of the two files has better-quality data: SRR19504912_1.fastq or SRR19504912_2.fastq?
Question 6: Are these datasets contaminated with any Illumina sequencing adapter oligonucleotides?
Trimming and filtering to remove poor-quality data
When you inspected the FastQC reports, you probably noticed that SRR19504912_1.fastq and SRR19504912_2.fastq include some sequence reads that contain very poor quality scores and some reads that are derived from the Illumina adapters rather than from the target viral nucleotide sequences. Now, we are going to look at how we can remove poor data and contamination by trimming and filtering. We will use TrimGalore by executing the following command on the Terminal:
trim_galore -q 25 --length 50 --paired SRR19504912_1.fastq SRR19504912_2.fastq
Now, when you list the contents of the directory with ls -lh, you will notice two new files called SRR19504912_1_val_1.fq and SRR19504912_2_val_2.fq. These are the trimmed-and-filtered versions of original files SRR19504912_1.fastq and SRR19504912_2.fastq. Now, let’s run FastQC on these two new ‘cleaned’ files:
fastqc *.fq
This will create QC reports, in HTML format, for the ‘cleaned’ FASTQ files. Now let’s take a look at these files:
firefox *.html &
Question 7: How many reads were removed by TrimGalore from each FASTQ file? Question 8: What impact has TrimGalore had upon the lengths of the reads? Question 9: What impact has TrimGalore had upon adapter contamination? Question 10: Has TrimGalore altered the distribution of quality scores?
You can read more about TrimGalore at https://www.bioinformatics.babraham.ac.uk/projects/trim_galore/.
Congratulations on reaching the end of this session! You should now be familiar with some of the most common file formats used in analysing NGS data and you know how to access and perform some basic QC on datasets of NGS sequence reads.
Bonus!
What if you had a large number of FastQC reports to analyze?
Multiqc (https://multiqc.info/) is a tool that summarizes different types of NGS reports (not just FastQC).
First, install the tool:
pip install multiqc
In the folder with reports, run:
multiqc .
See summarized report in a browser:
firefox multiqc_report.html &