Activity 2
Integration of data spreadsheets and the tree into an interactive visualisation with data-flo and Microreact
Next, all the files above, including the tree, were integrated with data-flo using the workflow below, which creates a Microreact visualisation as the final output.
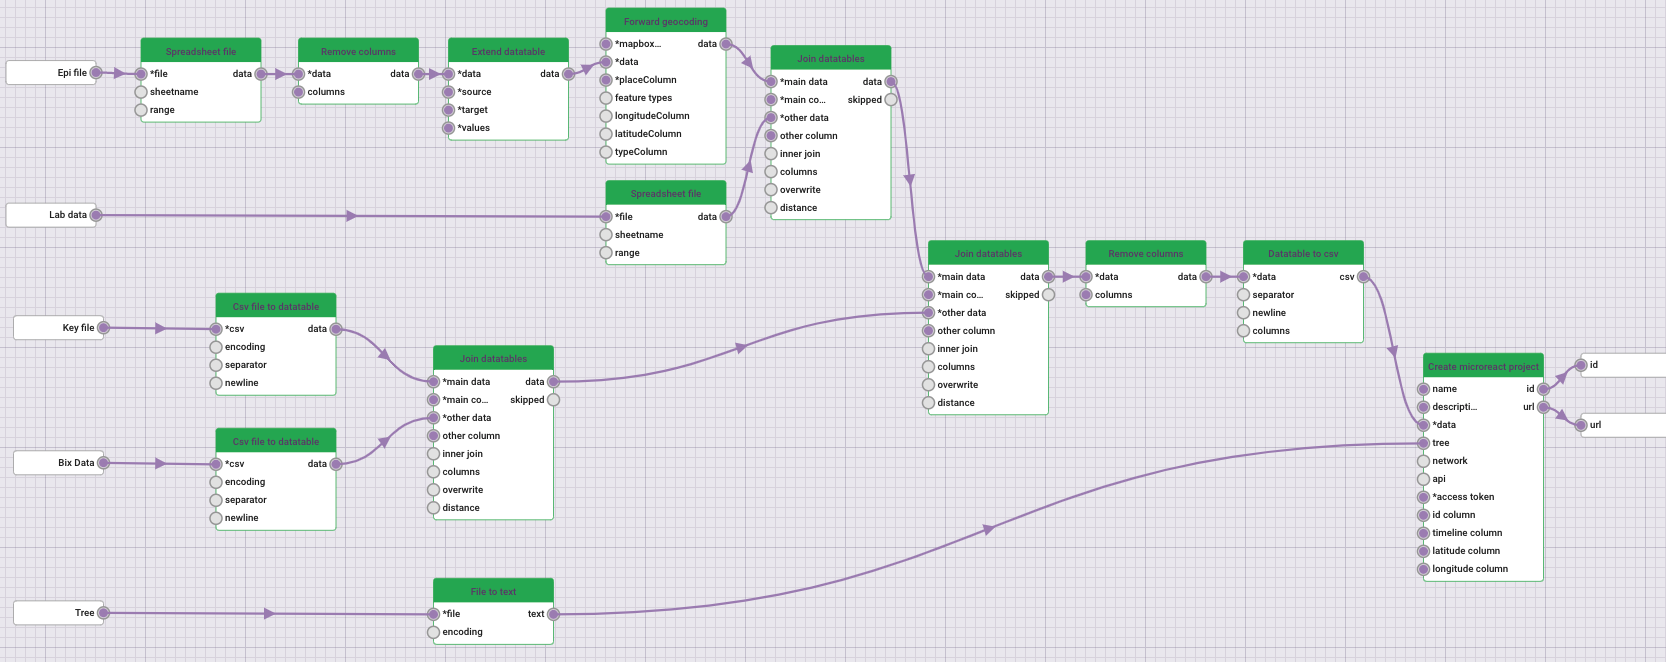
Note: If you would like to try to run this workflow, click on the link (https://data-flo.io/run?2cyJcXvbaNGzeSu9fJkWQq) to open it on a new tab, and then click on the button “Run”. Upload the requested files and click “Run” again. However, we encourage you to continue with the exercise and use the output provided below to complete the activity. You can come back to this once you are done.
Microreact (https://microreact.org/) allows you to upload, visualise and explore any combination of clustering (trees), geographic (map) and temporal (timeline) data. Other metadata variables are displayed in a table. You can specify colours and/or shapes to display on the map, tree and/or timeline. A permanent URL is produced for you to share your Microreact.
Using your Chrome/Firefox web browser, open the Microreact project created by the workflow https://microreact.org/project/4mfhQ4q53eHK1ECUihbiGM-case-study-crkp
The microreact project contains three windows: Map, Tree and Timeline. The Tree window of this Microreact project displays the Sample/Isolate IDs and Metadata Blocks. The tree window was customised to display the labels and metadata blocks and saved as a View.
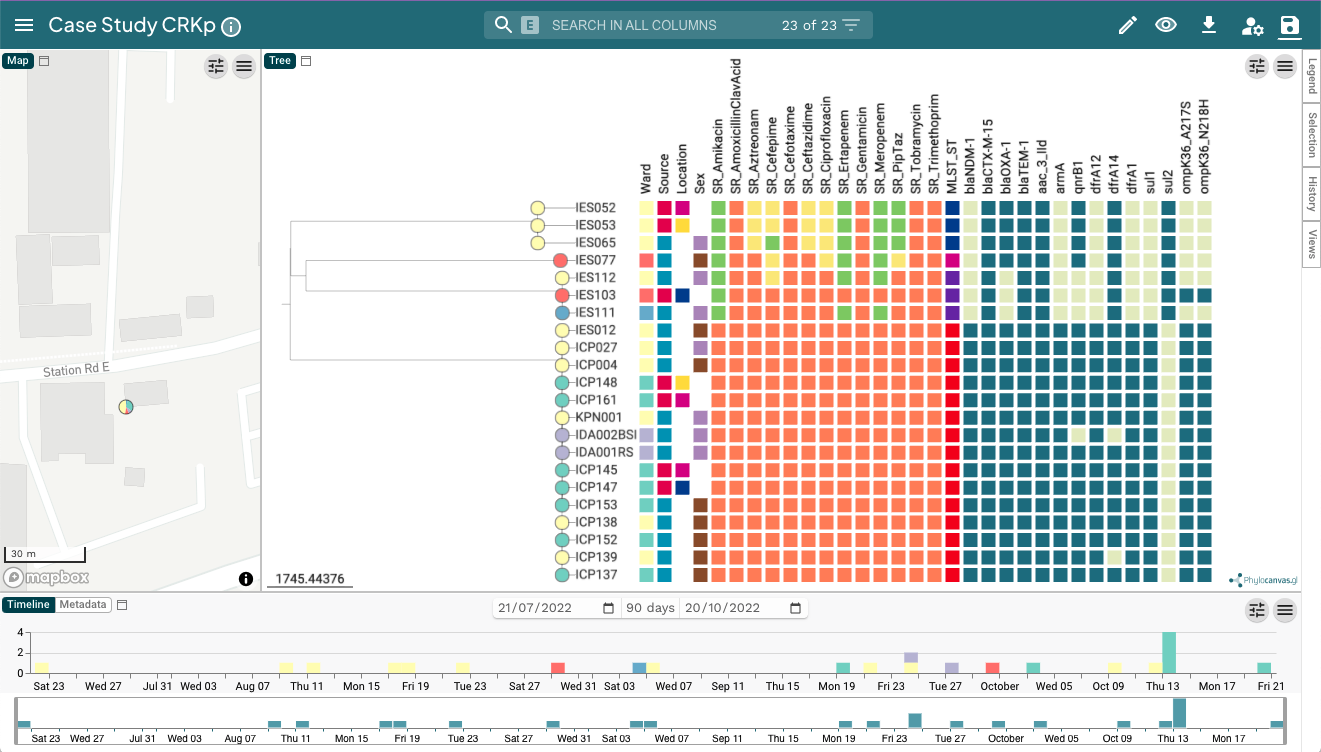
You can toggle between the timeline and the metadata table. To familiarise yourself with Microreact, answer the following questions:
Q8. What are the tree leaves coloured by? Open the legend drawer on the right.
Q9. Do the tree clusters match the MLST_ST assignments? Try selecting the main clusters (i.e., groups of genomes) one by one on the tree.
Q10. In which cluster is the index patient (ICP027) found in? Look for it with the search bar.
Go back to the default view with all the Metadata Blocks, and identify the carbapenem-resistant isolates.
Q11. Are they all closely-related? Try selecting and redrawing the cluster of carbapenem-resistant isolates. Right-click on the node and click “View subtree” from the drop-down menu
Q12. Is there an outbreak? If so, how many isolates are included in the outbreak?
Q13. In how many wards would you implement enhanced cleaning? How does this compare to your answer in Q3? Would you have made the same decision about enhanced cleaning based on Epi and Lab data only?