INTRODUCTION TO GENOMIC EPIDEMIOLOGY OF COVID-19

@Canva
The importance of sample and data consent
The major threat to global public health that SARS-CoV2 presented led to an unprecedented pace of much-needed research and vaccine development. This simultaneously meant the acceleration of ethical procedures that inform research and the performance of controversial studies e.g. controlled human infection studies (CHIs), where purposeful infection with COVID-19 to study its mechanism of infection is performed. Such research raised concern with regard to the ethical, legal, social and clinical implications of infecting healthy volunteers, where due process in any research is mandatory to consider the safety of the participant.
In general, genomics research involving human samples raises a number of ethical challenges such as consent, privacy, and the collection, storage and release of genomic data. In order to obtain valid consent from individuals involved in genomics and medical research, including SARS-CoV-2 and COVID-19 research, they must be adequately informed and the research must be understood, undertaken voluntarily, and provided by someone competent to do so.
Challenges exist in the designing and implementation of consent processes in regions with lower literacy levels. The provision of appropriate information in a comprehensible manner in genomics research is a critical challenge, as concepts around “genetics”, “genomics” and “data release” are complex to explain. Linking these concepts to more accessible levels of knowledge (e.g. that facial traits are inherited in families) may assist in narrowing this challenge. However, ensuring that all aspects of the genomics research are explained in this manner to obtain valid consent remains a critical obstacle.
Another ethical issue around sample and data consent is that the information produced from this research may affect additional people other than the participating individual. Privacy protection measures exist where personal identifiers are removed from genomic data, lowering the risk of revealing personal information. Yet, it is still possible for potentially stigmatising information about populations, communities or families to be revealed, which may have direct adverse effects on the individuals that consented to be involved, and indirectly on those with a relation to them.
These issues need to be addressed when designing consent processes for genomics research, even when faced with periods of emergency like the COVID-19 pandemic. Measures have been developed as guidelines through the collaborative development of informed consent document (ICD) templates. These are developed by and for genomics researchers in consultation with ethics committees, whereby discussions on consent procedures, challenges and best practices with researcher collaboration, participant privacy and safety, samples and data storage and so forth, take place.
Ethics review
Genomics research needs to obtain ethics approval from the relevant committees prior to the commencement of research. The review of genomics research can be challenging as the comprehension of the science may be difficult; the nature of the studies being hypothesis-generating rather than hypothesis-testing is complex. Teams must also consider how to generate a large amount of data that can be analysed numerous times in various ways, and which may also be shared amongst research groups.
These are the main points of consideration that have been raised by ethics committees when assessing genomics studies:
- Ensuring participants give valid informed consent.
- Justification of exporting samples and procedures pertaining to the
return or destruction of samples at the conclusion of the project.
- Ensuring the appropriate recognition of collaborative or local
investigators and their contributions.
- Ensuring no harm will be brought to participating individuals or
populations.
- Ways to assign benefits to the collaborating researchers or communities involved.
There are additional significant issues to review when obtaining valid consent for genomics research, which involves the importance of privacy protection. All personal identifiers that link an individual to genomic datasets must be removed, in order to reduce the risk of identification and to ensure anonymity. When performing large-scale collaborative research, such as the international efforts in the COVID-19 pandemic, ethics approval from a multitude of global committees is undoubtedly necessary. Due to the complexity of issues of consent and privacy, with different continents, countries, states and even institutions having varying requirements, there are major challenges in genomics research.
Further reading
SARS- CoV- 2 challenge studies: ethics and risk minimisation
Genomic research data generation, analysis and sharing – challenges in the African setting
Ethical implications of the use of whole-genome methods in medical research
Ethical issues in human genomics research in developing countries
Informed Consent in the Genomics Era
Ethics in data sharing
Over the past two decades, major advances in the molecular, cell biology and biotechnology research fields can be attributed to the pooled efforts of research teams and consortiums globally. Much of this collaboration is dependent on data sharing between researchers, which maximises the use of data generated. However, data sharing itself introduces new ethical considerations pertaining to informed consent, intellectual property, and ethical review standards. Given the sensitive nature of biological data, this article highlights the importance of ethics in data sharing.
Informed consent is a vital part of ethical research, ensuring that participants are not harmed or exploited. However, since widespread data sharing has become necessary for scientific innovation, concerns regarding the gaps in previous informed consent models have developed. Mainly that (i) data sharing can endanger the privacy of participant information, and (ii) current informed consent models do not account for the downstream uses of data that is stored or shared through biobanks. This means that new elements i.e., the concept of data sharing, awareness of the appropriate ethical authorities and boards, reasons for storing data/samples and timelines of how long data/samples can be stored in biobanks should be explained to participants. Beyond comprehension of the research parameters, informed consent should now also include continuous communication with participants at different parts of the research process. This will help facilitate trust in the research process.
Re-use of data benefits researchers by overcoming barriers to access to experimental data, reducing costs and leaving room to explore research questions that may only come up in future. On a wider scale, reluctance to share data slows down the progress of socially beneficial breakthroughs such as the development of new therapies and vaccines. Yet, the underlying ethical obstacle, in this case, is fairness, equity, and ownership of intellectual property in data sharing. Once data is made public, researchers that have access to better technologies are at an advantage in ownership, as they can analyse data and publish results faster. When two labs in one region have access to the same data, the issue of ownership can be attributed to the competition: however, when sharing data between resource-rich and resource-poor countries, the latter risk exploitation due to a lack of access to high-speed analysis technologies. This is a problem that requires the active participation of ethical review boards to mitigate unfair collaboration practices.
Ethics committees maintain and drive the standard for ethical research. Because the propensity for innovation in biosciences through data sharing is beneficial, there is a need for ethics boards to review access to shared data/samples. Data access committees determine the legal, ethical, and scientific eligibility of researchers requesting data/samples from biobanks. This eligibility could include the context of the researcher’s work to make sure it is relevant to their outcomes, as well as its applications pertinent to the needs of the community that the research group would serve. The process of developing quality ethical review will also have to develop alongside the practice of data sharing, as new challenges emerge.
Data sharing in the scientific community has multiple benefits and shows promise in advancing knowledge and innovation in the bioscience and medical fields. This makes the appropriate measures for data sharing an important subject, as ethical standards for data sharing will prevent harm and promote fairness that benefits researchers and the communities they serve.
Further reading
Genomic Research Data Generation, Analysis and Sharing – Challenges in the African Setting
Responsible, practical genomic data sharing that accelerates research
Metadata: standardisation and collection tools
Source: Hugh Fox III
Click here to enlarge the image
Download Figure 1 alt-text here
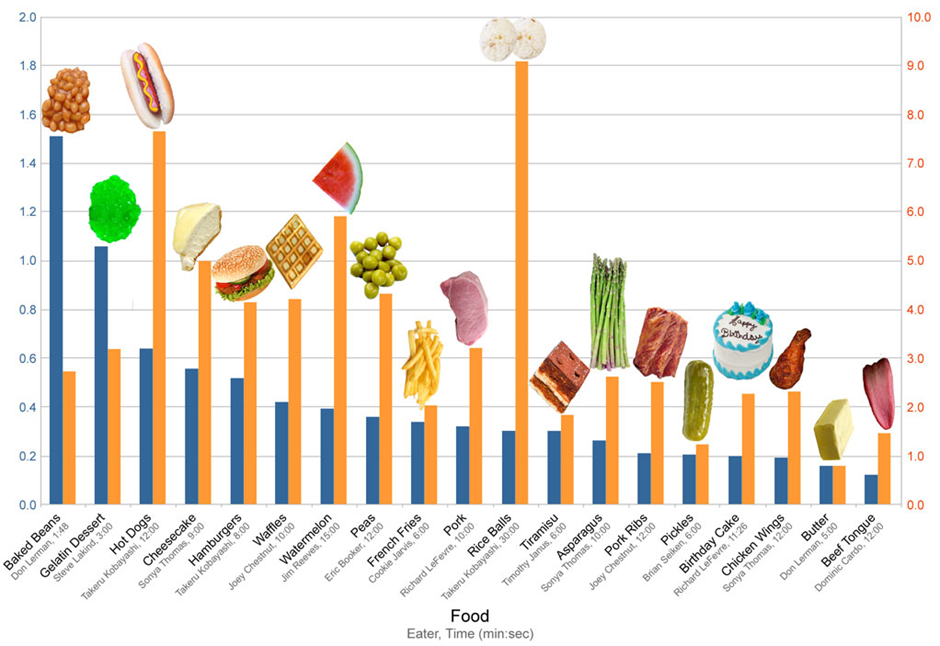
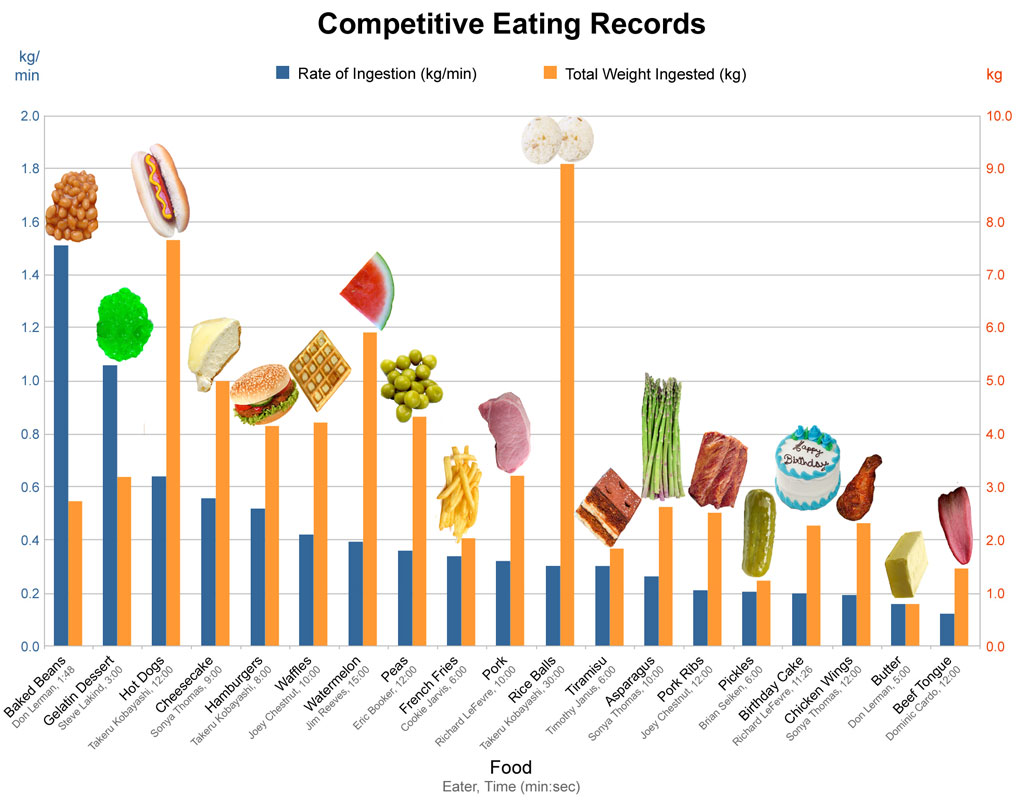
Imagine coming across this interesting-looking graph in Figure 1 above, but not knowing exactly what it’s trying to show you. The heading which read: “Competitive Eating Records” has been cropped off, and there are missing y-axis labels which should have shown that the yellow bars were the total weight of food ingested (kg) and the blue bars were the rate of ingestion (kg/min).
This illustrates that even if you have the best quality data if your data has no context, you have no story.
So what exactly is metadata, and why is it important?
It is now easier than ever to access millions of sequenced datasets deposited in public databases. This mining of data enables us to do extensive meta-analyses to gain new and unexpected insights into the underlying biological mechanisms across viruses and the tree of life.
However, this process is often hindered by a lack of accompanying metadata. Metadata comprises any data that describes the sample type, collection procedure, extraction, assay methods used, analysis with the chosen parameters, filtering steps, quality control, reporting of software versions, as well as any other phenotypic descriptions.
Most of the time, some metadata is provided during data submissions, but this metadata is often unstandardized. A standardised format implies that there is a checklist which necessitates that a minimum amount of metadata must accompany the data and that free text is limited in favour of a controlled vocabulary.
The COVID-19 pandemic has especially highlighted how necessary it is to have informed data. Metadata such as the time and the place where the samples were collected, which may have not been as important to genomic datasets before, suddenly became crucial. Many repositories such as GEO and ENA now require research teams to use a metadata sheet with compulsory fields that must be populated when submitting data. Extensive efforts have also been made towards both manual curation and the automated assignment of metadata, through natural language processing (NLP) and the use of machine learning models.
Describing the WHO, WHAT, HOW, WHERE, and WHEN of genomic data also contributes to the findable, accessible, interoperable and reproducible (FAIR) guiding principles, to support the reuse of scientific data, and very importantly, it helps to inform public health responses.
Although we acknowledge the importance of accompanying genomic data with the appropriate metadata, we also have to be cognizant of the fact that the collection, anonymisation, storage and access to this data have to be carefully managed in a way that protects the donors. Submitting a data management plan as part of the research plan has therefore become an increasingly standard procedure.
Ownership of analyses tools and pipelines
Bioinformatics provides tools to catalogue, analyse and manage biological research data and information, through tools like algorithms, databases and software. Accessibility to these tools is essential for the advancement of genomic research and the development of the bioinformatics discipline. It is important for investors and developers of these tools to be acknowledged, ensuring they receive their credit where it is due, which in turn encourages continued innovation and investment.
Intellectual Property Rights (IPRs) is a model that ensures the protection of developers and economic incentives for investors. However, conflicts arise with the open and collaborative nature of bioinformatics. Intellectual interactions between the developers and research scientists using these tools or bioinformatics pipelines are essential to the successful reporting of results in publications and warrant the appropriate acknowledgements. If the research involves bioinformaticians that contribute to novel work, insight and advanced data analysis contributing to publications, this requires co-authorship and acknowledgement of the value of the contributor.
Acknowledging the ownership of analysis tools and pipelines is recommended for:
- Substantive contributions to the research project through its
conception, design or the input of original ideas;
- Acquisition of data, its analysis and interpretation through the use
of tools beyond routine practices;
- Intellectual contribution to the manuscript through critical delivery of the content, such as the methodology involved in the use of the pipeline.
Further reading
Intellectual Property Protection in Bioinformatics and Open Bio Development
Best practices for data sharing
Today you can sequence the SARS-CoV-2 genome within hours once a case of COVID-19 positive is identified. This has enabled the creation of molecular diagnostic assays, improved global preparedness, and countermeasures, the development of vaccines and the prediction of newly emerging variants during the pandemic. Virus genome sequencing and predicting lineages also contribute to understanding the dynamics of viral epidemics and evaluating the efficacy of control measures.
With the rapid sharing of the genome sequence data, accurate anonymized epidemiological and clinical metadata will have a positive impact on public health and maximise the impact of genomic sequencing in the public health response. There are several factors that are to be considered while sharing, analysing and publishing the sequence data. Below are some of the best practices put together by the SARS-CoV-2 community that can be followed at every laboratory:
- Acknowledgement of those who are involved in collecting clinical
samples and generating viral genome sequences.
- When publicly available data is used, the data source, publications
and pre-print articles have to be cited where available.
- Funders, Journal editors and Peer-reviewers should encourage
sustained data-sharing.
- Sharing the anonymised sample metadata with the genomic sequence
will lead to the optimal utility of the SARS-CoV-2 genomic
sequence.
- The date and place of sample collection should always be included in
shared metadata, but extra metadata will considerably expand the
sequence’s potential applications.
- Data about the sample type, how the sequence was obtained, links to
other sequenced viruses, patient travel history, and demographic or
clinical information should all be included in metadata where
available.
- When any information is shared, it is important that patient anonymity is protected.
WHO guidelines provide recommendations on how to format the data before sharing. See some examples of sample-specific metadata format in the table below:
| Metadata type | Recommended format if applicable |
|---|---|
| Date of sample collection | YYYY-MM-DD |
| Location | Continent/country/region/city |
| Host | For example, human or mouse |
| Patient age | For humans, give an age in years (e.g. 65) or age with the unit if under 1 year (e.g. 1 month, 7 weeks) |
| Sex | Male, female or unknown |
| Additional host information | No standard format - for animals, this may include context, such as “domestic - farm”, “domestic - household”, “wild”, etc. |
| Travel history | No standard format - travel history in the 14 days preceding symptom onset should be obtained from patients where possible |
| Cluster or isolate name | No standard format |
| Date of symptom onset | YYYY-MM-DD |
| Symptoms | No standard format |
| Clinical outcome if known | No standard format |
| Specimen source, sample type | No standard format - examples: “sputum”, “blood”, “serum”, “saliva”, “stool”, “nasopharyngeal swab” |
Additional Information regarding the sequencing data:
| Metadata type | Recommended format if applicable |
|---|---|
| Sequencing technology | No standard format - ideally, this should include the laboratory approach and sequencing platform (e.g. “Metagenomics on Illumina HiSeq 2500” or “ARTIC PCR primer scheme on ONT MinION”) |
| Assembly method, consensus generation method | No standard format |
| Minimum sequencing depth required to call sites during consensus sequence generation | e.g. 20x |
Further information
Data quality metrics
Large-scale sequencing - a limitation to the quality
Since the pandemic began multiple consortiums and collaborations between public and private sectors have been established to sequence and publish the SARS-CoV-2 genomes in real-time. As of 19th May 2022, there were 10,900,329 genome sequences available at GISAID which is the largest number of whole-genome sequencing (WGS) carried out for any organism today. Even though there is an increased number of WGS that are being carried out, there is no universal agreement between different consortia as to what quality criteria have to be followed when sequencing or using the publicly available SARS-CoV-2 genomes for analysis.
Multiple laboratories, protocols and strategies are impacting the data generated
Currently, there are several sequencing strategies, with multiple protocols that are being used that are conserved for that consortium or the country as a whole. Public health laboratories follow their own sample selection criteria, library preparation and sequencing platforms, bioinformatics workflows, and data interpretation, resulting in inconsistent data quality standards and biases among SARS-CoV-2 sequences generated in public databases.
While these issues are not unique to public health laboratories, providing basic guidance on SARS-CoV-2 sequencing and data-sharing practices will improve coordination among laboratories that have been conducting sequencing and set expectations for public health laboratories that are currently expanding.
Following WHO standards is the key
In order to provide clear expectations and a basic standardisation across public health laboratories, WHO recommendations and protocols should be followed worldwide. The WHO recommendations for the Data Quality and Sharing Parameters guidelines are discussed below
Submission to multiple databases
Submitting to multiple public databases ensures public health and the broader research community access to SARS-CoV-2 sequencing data. To support this effort, public health laboratories are encouraged to submit SARS-CoV-2 consensus assemblies to the GISAID EpiCoV™ repository, the National Library of Medicine’s National Center for Biotechnology Information (NCBI), GenBank, and the NCBI Sequence Read Archive (SRA).
Best Practices for Quality Control
Quality control is the essential first step in the analysis of sequencing data before being used in any study. Several useful tools are available to help detect ambiguous bases, indels and frameshifts, including the Nextclade QC metric feature, CoV-GLUE and Pangolin that can be used to evaluate the assemblies for basic quality metrics. QC methods can be carried out at several stages to identify multiple characteristics that may be linked to low-quality sequences.
- Removing sequences with ambiguous bases, indels or frameshifts based
on unaligned/aligned sequences.
- Removing sequences with > 10% Ns in regions of interest may be
appropriate in the first instance.
- Sequences with suspected underlying sequencing errors (for example,
induced by misassemblies) should be investigated, and usually
removed.
- Sequencing errors can manifest as high divergence compared with
other sequences or as high numbers of substitutions in short regions
that may indicate local misassemblies.
- High numbers of non-ACGTN bases may be indicative of mixed viral
populations as a result of contamination.
- The sequences should have 90% or greater genome coverage.
Further reading
WHO Genomic sequencing of SARS-CoV-2: a guide to implementation for maximum impact on public health
Pros and cons of public databases for data sharing
The collaborative nature of bioinformatics and genomics research requires openness and data sharing amongst scientists, researchers and innovators. Bioinformatics databases represent organised bodies of data associated with computer software designed to update, query and retrieve components of the stored data. Ideally, these databases serve to provide easy access to information and facilitate data retrieval for analysis and comparative studies.
Developers of large consortium studies such as the Human Genome Project state that data obtained from the research and stored in online repositories should be publicly available (e.g. National Centre for Biotechnology Information, NCBI), on the basis that genomics research acceleration relies on the accessibility to this kind of information. In the era of COVID-19, open data sharing accelerated COVID-19 research and this concept benefitted millions of scientists around the world and was essential for a rapid response to the pandemic. However, developers and funders of research initiatives have alternative goals of economic benefit resulting in the creation of private genomic databases.
The concept of open science that can be shared and freely used provides a useful alternative that assists bioinformaticians and scientists overcome the lack of access to their own data - for example in African countries, where the limited availability of funding requires the generation of experimental data in external institutions that are based in high-income countries.
The advantages involved with open science include the provision of opportunities to verify original analyses; address new biological questions; the improvement of research reproducibility; enable testing of new and secondary hypotheses; develop and evaluation of new methods; produce new services through inter- and trans-disciplinary research; meta-analyses through the combination of datasets from different sources to achieve higher statistical power and new observations. Some cons or concerns involved in the practice of open data sharing include: endangering the privacy of research participants’ data; downstream uses of data not authorised in the initial informed consent retained.
Several resources are available to address concerns with open science such as Data Access Committees (DACs), responsible for the release of data to external parties based on legal, ethical and scientific eligibility. The data repositories provide the infrastructural solutions that enable scientists to use the data in a safe and ethical manner while speeding up the transfer of knowledge among researchers across scientific fields. A growing number of funding agencies and publishers advocate for and enforce data management for open science, however, challenges still exist for the proper exploitation of the data. While most scientists desire open access to data from others, the same enthusiasm is hardly noted in the dissemination of their own data, unless the intellectual property is awarded.
Further reading
Open data sharing accelerates COVID-19 research
Genomic research data generation, analysis and sharing – challenges in the African setting
Intellectual Property Protection in Bioinformatics and Open Bio Development
When and why to obtain sequencing data
As humans, we have an innate ability and even need to spot patterns. Psychologists have found that we use patterns to build rules that guide us to make faster and more accurate decisions.
So, what does this have to do with sequencing data? Everything!
Let’s take a step back. What do we know about SARS-CoV-2? We know that it accumulates ~33 mutations per year per genome. These mutations are important because we use them to track the spread and evaluate the effectiveness of our interventions. They also enable us to classify SARS-CoV-2 into lineages, clades and variants and to observe specific symptoms and the severity of the disease.
Sequencing data not only gives us insights into the size and growth rate of an epidemic but also monitors the evolution and spread of variants. In the long term, rapid and large-scale sequencing allows us to track new variants to aid in vaccine development.
So, we use a collection of sequenced data to spot trends and patterns during genomic comparison, so that we can classify data and respond to a crisis faster and more accurately than if we did not see a pattern. It allows us to make some predictions. Predictions such as, “we are due for another viral outbreak.”
When and why would a laboratory or an individual researcher want to obtain sequencing data?
When you have a biological sample and you do not have prior knowledge of where all the significantly expressed regions are, and so you cannot design primers to amplify those regions, but you really want to know which coding genes are present, which non-coding regions are expressed, as well as where all the mutations are across this genome. In this case, you can apply whole-genome sequencing.
If you want to know where all the mutations in the protein-coding regions are, you can use whole-exome sequencing. If you are interested in which genes are differentially expressed in one sample versus another, you might use RNA sequencing. There are many types of sequencing and technologies, depending on our research questions.
Another interesting justification for sequencing data is when you have a very little amount of sample, severely degraded samples, or a mixed sample. This is typically the case in forensics. For these types of analyses, the conventional PCR approach is not suitable, but sequencing can provide valuable insights.
If you have a hypothesis you wish to test, but you don’t have any biological samples of your own, or you have samples, but you just don’t have enough to work with. To detect significant effects in your data you need a sufficient amount of data points to back it up and to actually see the patterns. You need to consider statistical power and sample size.
You can still do research without generating your own data. Data concerning many different sample types, such as virus or (micro)organism, geographical location, race, sex, age group and disease can be found in free data repositories. This data repository guidance from Scientific Data will guide you to an array of public data repositories that you might find useful.
How and where to obtain the public data
In this video, you are going to learn to access publicly available SARS-CoV-2 genomes and download them. You will also learn how to download the metadata associated with the genomes.
Challenges and limitations of data sharing
In this video, Dr Ewan Harris from Wellcome Sanger Institute shares his experiences dealing with legal considerations when sharing data among partners from different countries. Read more about the challenges and limitations of data sharing in the text below.
Obstacles to the release of data
We are living in an unprecedented era of information, leading to progress for open access to science and global research data. Funders around the world are increasingly mandating good data practices, such as data management plans and data sharing, and recognising the importance of global collaboration on infrastructure and best practices. Across the research community, policy, strategy, and working groups are building momentum toward a future in which research data is widely Findable, Accessible, Interoperable, and Reusable (FAIR). In this section, we discuss a variety of challenges associated with data sharing, such as obstacles to the release of data, privacy and confidentiality issues, and informed-consent issues.
There are a variety of challenges associated with data release. Some are related to the concerns of the scientists who generated the data, some are related to the concerns of businesses or other organisations that paid for the data collection, and some are practical issues related to data administration.
Concerns about adversarial science
Regrettably, research can be highly contentious and confrontational at times. For example, industries that profit from the production or use of specific chemicals or goods may oppose research and/or data indicating that their specific chemicals or goods pose health risks.
Business considerations related to data sharing
When deciding whether to share data, businesses always consider a variety of factors. Two of the most significant are concerns about exposing themselves to liability and other costs, as well as concerns about losing the value of confidential business information.
The business value of data
There is also the question of who pays for access to data that a company has paid for. Regulatory agencies are generally required to safeguard the commercial value of data collected by businesses. The most important fact is that the data generated by industry researchers have commercial value. Companies that collected data deserve and expect to be compensated for supplying that data to others; however, where should that compensation come from? If another company wants to use the data, the answer is obvious; however, if academic researchers want to use the data, the answer is less clear.
Administrative issues
Data sharing is also complicated by a number of administrative issues, one of which is who owns the data. This is especially problematic when data has been collected by groups of companies or institutions. Other administrative challenges include the fact that organisational policies and procedures, as well as logistical issues, may differ from one organisation to the next. For example, different universities’ institutional review boards may have different rules governing data-sharing procedures.
The cost of Data-sharing
The cost of extensive data sharing is a major impediment. The issue is that most budgets do not cover the costs of data sharing. If data are to be made publicly available, the funds to do so must come from somewhere, perhaps from direct research support.
Privacy and confidentiality issues
One of the barriers to data release is ensuring the privacy of the persons whose data has been obtained as much as possible, as some of these data, such as medical history data or employment data, can be highly sensitive. Organisations are putting plans to share data on hold due to concerns over re-identification. A key question is how likely is re-identification of subjects in existing data sets that have had the obvious personal identifying information removed.
Informed consent issues
Before an individual can take part in a scientific or medical research study, it is generally necessary for that person to provide “informed consent.” The problem is that when you ask someone for consent, especially broad consent, neither the requestor nor the person being sought has any idea what that means in terms of how it will be utilised because we do not know what it will be used for down the road. The second point is that when people asked for consent a long time ago, we knew that consent meant you were not going to provide anything to someone else, but as long as we removed your name from it, it was fine.
Insufficient tools and technology
The technological challenges highlighted include transferring large datasets, particularly to the African region. Furthermore, technology is viewed as simplifying data-related operations rather than adding complexity. However, many alternative cloud data providers are now accessible, each with their own set of data access rules. As data teams continue to rapidly embrace numerous cloud data platforms, this heterogeneous patchwork of capabilities frequently fails to scale effectively across different cloud data platforms. As a consequence, either too tight data rules that prevent data exchange entirely, or overly wide policies that allow sensitive data to slip through the gaps, resulting in a data breach or leak.
Further reading
Best practices for presenting your data
Presentations are an important part of the research process and allow the researcher a chance to illustrate the heart of their research to a public audience. The use of graphs in presentations is a powerful way to portray the narrative that the data analysis is representing. However, there are a few tips and guidelines that every researcher should consider when using graphs in public presentations. Let’s go through a few of them:
Less is more
It is important not to overwhelm your viewers with busy graphs that are difficult to read and complex to interpret. When presenting your work, simplicity is often the best way to go as it helps prevent people from being distracted by the graphs and not listening to you present the content.
Highlight key data points
We all understand that as researchers we are proud of the data we have generated and analysed, but often there is too much data to consume in one presentation. When presenting, try to summarise the data and discuss the most important or exciting data points.
Be careful when displaying sensitive data
Sensitive information and data are often necessary and vital parts of the data generated in the research you may be undertaking. However, it is crucial that you, as the researcher, make sure that sensitive data is protected and anonymised, as well as consented to by those the data would impact.
Eliminate redundant labels
Clutter around your graphs makes it difficult to read and observe the audience listening to you. So, it is important to eliminate unnecessary labels and data points that have no bearing on the message that is potentially being portrayed.
Choose the charts that best tell your story
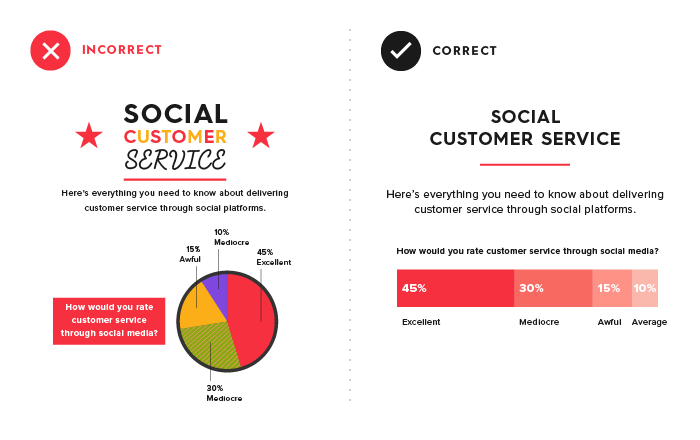
For example, a pie chart should only be used when you have two categories, or if you really want to push it, up to 6 categories. This is because a pie chart leaves it to the user to find the comparisons.
Therefore, when multiple categories are compared, it may be more effective to use a bar graph (Figure 2). Similarly, when you use a line graph, the reader will expect to see changes over time. Histograms, on the other hand, should be used to show where your data is clustered. You will find more examples of when to use which graph in this article from Tableau.
Source: Column Five Media
Click here to enlarge the image
Download Figure 2-3 alt-text here
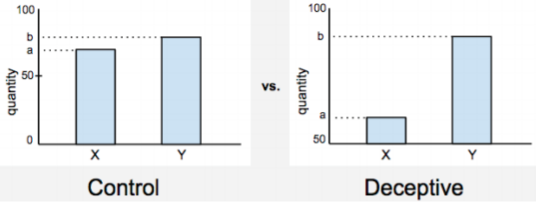
Include a baseline
It’s common to find a graph which does not start at zero. “So what!”, you say. One can still see when one value exceeds the other. That is true, but as shown in Figure 3, these values may be grossly exaggerated when we don’t see the start line. Similarly, you may find a graph giving you a bunch of fasting blood sugar levels for school kids. How would you know which values are good/bad without a baseline stating that it should be below 99 mg/dL?
Source: Chad Skelton
Click here to enlarge the image
Use colours meaningfully
Colours are a crucial part of the graphs used to present your findings, as they are a powerful visual aid that will help your viewer easily interpret and remember the data. However, colour can also completely ruin the way you represent your data and become a stumbling block for your viewers. Firstly, choose a colour scheme with more neutral colours, as brighter colours are more likely to clash with others. Secondly, it is likely that some of your audience has some form of colourblindness, so you should consider the impact this may have. You could avoid certain colour schemes (the most common form of colourblindness is for red and green) and/or ensure there is sufficient differentiation between shades that colourblind people would nevertheless be able to appreciate the difference.
Choose colours that allow the text colour to be easily read; you can change the text colour to white rather than the standard black, but it should be consistent. Similarly, think of the background colour of the presentation the data will be displayed against. It’s usually good practice to use solid or matte colours, rather than patterned effects. If using a gradient colour scheme, e.g. all data is in different shades of blue, then ensure there is sufficient differentiation between each gradient.
Think carefully about colour associations the audience may make. For example, it may be confusing to have negative data shown in green while positive data is depicted in red.
In general, try to keep a consistent colour scheme throughout your presentation to make it easier for your audience to follow.
Avoid using special effects
Avoid using excessive special effects, including dramatic slide transitions or animations, as they can be distracting and, in some cases, very unprofessional. Be wary when using special effects and only use them when they are truly necessary for the graphs.
Make sure you use the right text and fonts
One of the most overlooked aspects of a graph is the chosen font, as well as its size. We often want to have a cool and funky font to use for our graphs, but these fonts must be readable and professional. So, when choosing a font, think of what the head of the research group would be happy to see in your presentation.
Use white backgrounds
Try not to use colour backgrounds for graphs and use white backgrounds whenever you are adding graphs to your presentation. This is to ensure that all values and illustrations in the graph can be read and viewed by your audience.
These are just a few tips and guidelines that will hopefully aid in you creating the best presentations.
Public health reports and sharing
During the early 2000s, viral genomic sequencing gained more importance with the emergence of Severe Acute Respiratory Syndrome (SARS) and the Middle East Respiratory Syndrome (MERS) epidemics.
Even though genomics was used to study the association between the virus concerned and epidemiology, it was not in real-time and was not on a large scale. When SARS-CoV-2 infection was first reported, within a month there were 6 sequences available in the public domain and within the following few months, the number of sequences rapidly reached several thousand. These genomes were generated, reported and shared within days of case identification and used to understand virus spread.
The rapid and large-scale sequencing during the SARS-COV-2 pandemic and genomic analyses gave epidemiological dynamics of viral disease which was not possible with epidemiological data alone. Reporting these dynamics and the epidemiological significance of new emerging variants is of significant importance in public health management.
WHO shares weekly reports about the COVID-19 infections worldwide. You will find an example of these reports for download below.
Resources
Datasets for this course
Zenodo repository: Making sense of genomic data: COVID-19 web-based bioinformatics
Coronavirus biology: ViralZone
Coronavirus taxonomy: International Committee on
Taxonomy of Viruses (ICTV)
SARS-CoV-2
replication cycle by Sultanas, Inc
Real-time tracking of pathogen evolution: NextStrain
Lineages nomenclature: Pango
Genomic data sharing: GISAID
Cloud Infrastructure for Big Data Microbial Bioinformatics: CLIMB
COVID-19 Genomics UK Consortium: COG-UK
NCBI COVID-19 scientific literature: LitCovid
SARS-CoV-2 sequencing protocol: ARTIC protocol
Further training on Galaxy: Getting
data into Galaxy
Further information about COVID-19 reports: WHO
COVID-19 reports and CDC
COVID-19 report format